Index
Benchmarks
Our benchmarks of choice for testing this notebook include Cinebench R15, CrystalDiskMark, PCMark 8 and HWBOT’s latest x265 encoding benchmark. The first program provides a quick look at synthetic single-threaded and multi-threaded performance, while PCMark 8 provides some real-world benchmarks for productivity uses. Lastly, the x265 test measures the Kaby Lake processor’s hardware encoding and decoding acceleration for 10-bit HEVC/h.265 video.
Cinebench R15
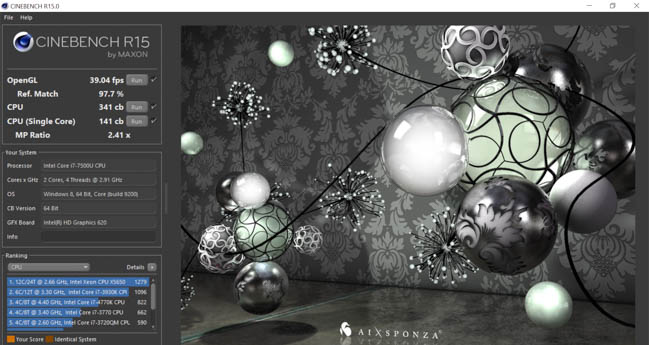
Cinebench is a synthetic benchmark that measures CPU and graphics performance using OpenGL. The program uses algorithms to render a photorealistic 3D scene containing over 300,000 polygons and displays the results based on a point system.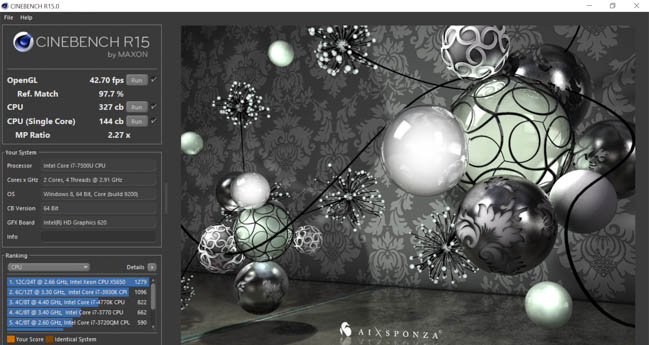
Cinebench R15 battery score
Cinebench R15 plugged in score
In Cinebench R15, the notebook is able to run the OpenGL graphics test at 39.04fps while plugged in and 42.70fps on battery. In the single-threaded test, the CPU gets 141 points while plugged in and 144 points on battery, while in the multi-threaded test the CPU gets 341 points plugged in and 327 points on battery.
NotebookCheck.net mentions in its review that the Core i7 7500U on the Spectre x360 scores consistently slower than other notebooks equipped with the same chip. They note that notebooks such as the MSI CX72-7QL offer improved Turbo Boost performance, resulting in 15 percent higher scores. However, in their multi-threaded test, the CPU gets just 314 points, which is 9 percent lower than our plugged in score and 10 percent lower than our battery score, so it seems that there could be different thermal management profiles between the notebooks. We can also note that our power profile is set to “Passive” mode, which slows the processor before increasing fan speed to avoid unwanted noise.
CrystalDiskMark
CrystalDiskMark measures sequential read and write performance, and random read and write performance at various sizes. It allows users to gain a surface-level understanding of drive performance similar to those found on product retail packaging.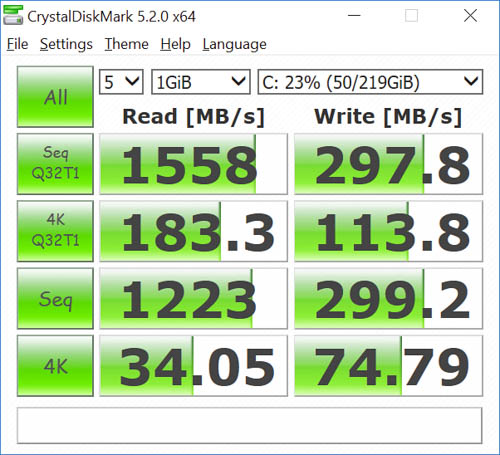
In the default 1GB random data test, the Samsung PM951 256GB M.2 NVMe SSD scores 1558MB/s in sequential reads and 298MB/s in sequential writes, quite a significant gap that may affect database workloads or sustained large file transfers. Meanwhile, the 4K QD32 test shows 183MB/s random reads and 114MB/s random writes, while standard 4K test shows 32MB/s random reads and 75MB/s random writes.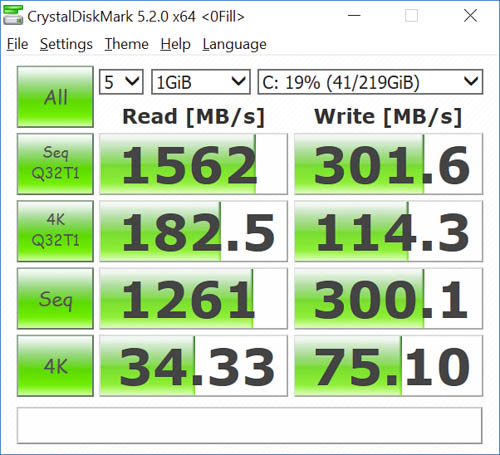
In the 1GB 0fill data test, the drive scores 1562MB/s in sequential reads and 302MB/s in sequential writes, while the 4K QD32 test shows 183MB/s random reads and 114MB/s random writes. The standard 4K test shows 34MB/s random reads and 75MB/s random writes. Of course, with a higher capacity drive such as the 512GB or 1TB option, write performance should increase with each tier, though the 256GB option still offers higher performance than most comparable SATA III based M.2 alternatives.
PCMark 8
Futuremark's latest PCMark 8 application is an industry standard way of testing popular productivity applications from Microsoft Word to Adobe Reader. We ran the Home test, which measures baseline performance for common task-intensive workload situations including photo editing, gaming, web browsing, writing and video chat.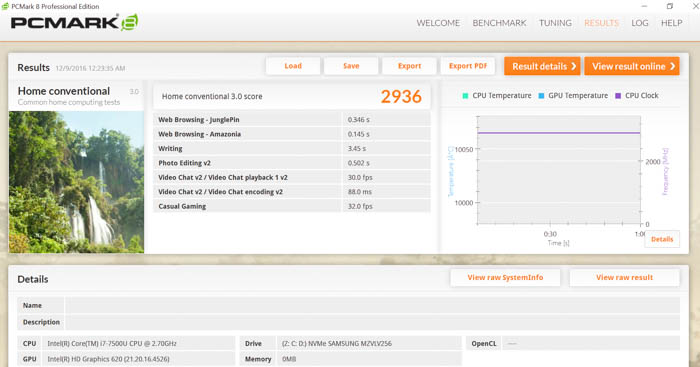
With the test run in Conventional mode, the notebook scored 2936 points, consistent with results from the folks at UltrabookReview.com who scored 2964 points in the same benchmark.
HWBOT x265 Benchmark 2.0
Earlier last year, the community at HWBOT released a new x265 benchmark with its own GUI that takes advantage of modern CPU instruction sets and multi-threading capabilities. The software was developed by Czech overclocker Havli for the purpose of rendering video in 1080p and 4K resolutions using the x265/HEVC encoder. The benchmark requires that a system’s HPET (High Precision Event Timer) feature is enabled, and this can be done using a simple bcdedit command.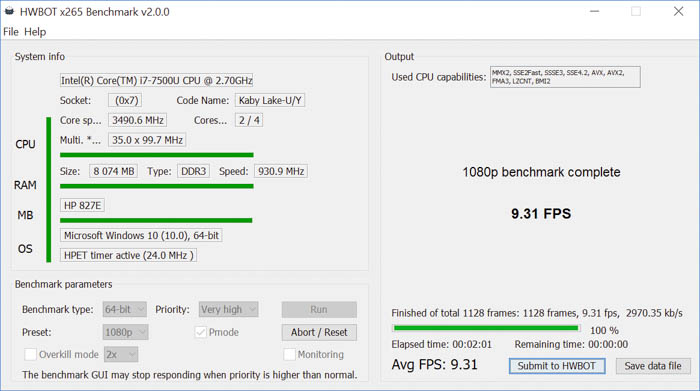
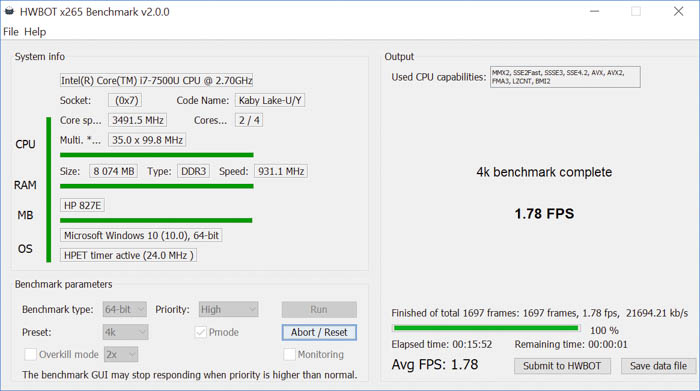
We ran the HWBOT x265 2.0 program using the “PMode” (HEVC) encoding option in 64-bit mode. In the 1080p benchmark, the system scores 9.31fp, while in the 4K benchmark it scores a much lower 1.78fps. Based on other user results in the HWBOT rankings, this fits in somewhere between a Core i3 6100 and an AMD A10-7850K, though it is difficult to give an accurate estimate among other more recent CPUs given the relatively small database at this point.

