Index
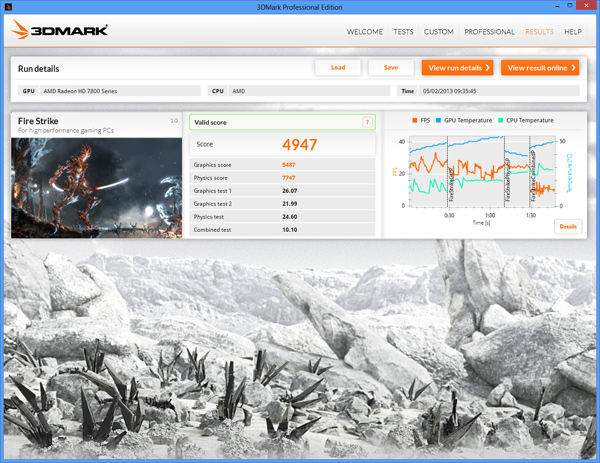
Fire Strike will output the overall score, graphics score and physics score. Average frame rates are given for the two graphics tests, the physics and combined test. Of course, the more powerful your hardware, the smoother the tests will run. We used three XFX graphics cards for comparison and we got the following results:
|
3DMark Score (Fire Strike Default preset) |
|
|
XFX HD 7950 Black Edition |
5793 |
|
XFX HD 7870 Black Edition |
4947 |
|
XFX HD 7770 Black Edition |
2871 |
|
Graphics Score |
|
|
XFX HD 7950 Black Edition |
6480 |
|
XFX HD 7870 Black Edition |
5487 |
|
XFX HD 7770 Black Edition |
3077 |
|
Physics Score |
|
|
XFX HD 7950 Black Edition |
7772 |
|
XFX HD 7870 Black Edition |
7747 |
|
XFX HD 7770 Black Edition |
7774 |
|
Combined Score |
|
|
XFX HD 7950 Black Edition |
2662 |
|
XFX HD 7870 Black Edition |
2171 |
|
XFX HD 7770 Black Edition |
1174 |
The 3DMark score, graphics score, physics score and combined score are shown in the 'Run details' screen after the benchmark is complete. We also see average frame results for the two graphics tests, the physics and the combined test, and also graphs for those results.
You can interactively search the graphs and see different measures over time, for example the frame rate, GPU temperature, CPU temperature, CPU Power, CPU clock. You can decide what you want to see in the graphs simply by unchecking some check boxes. It would be nice to have option to export the graphs, however, the results are auto saved locally on the machine and we can load saved results and generate the graphs again. The ability to save results online is very useful.


